Shop dashboard
Northline Fabrication
Internal analytics: cash, margin, and revenue, read from QuickBooks and Monday and shown against the shop’s own goals.
*Actual business name and data has been replaced with sample data
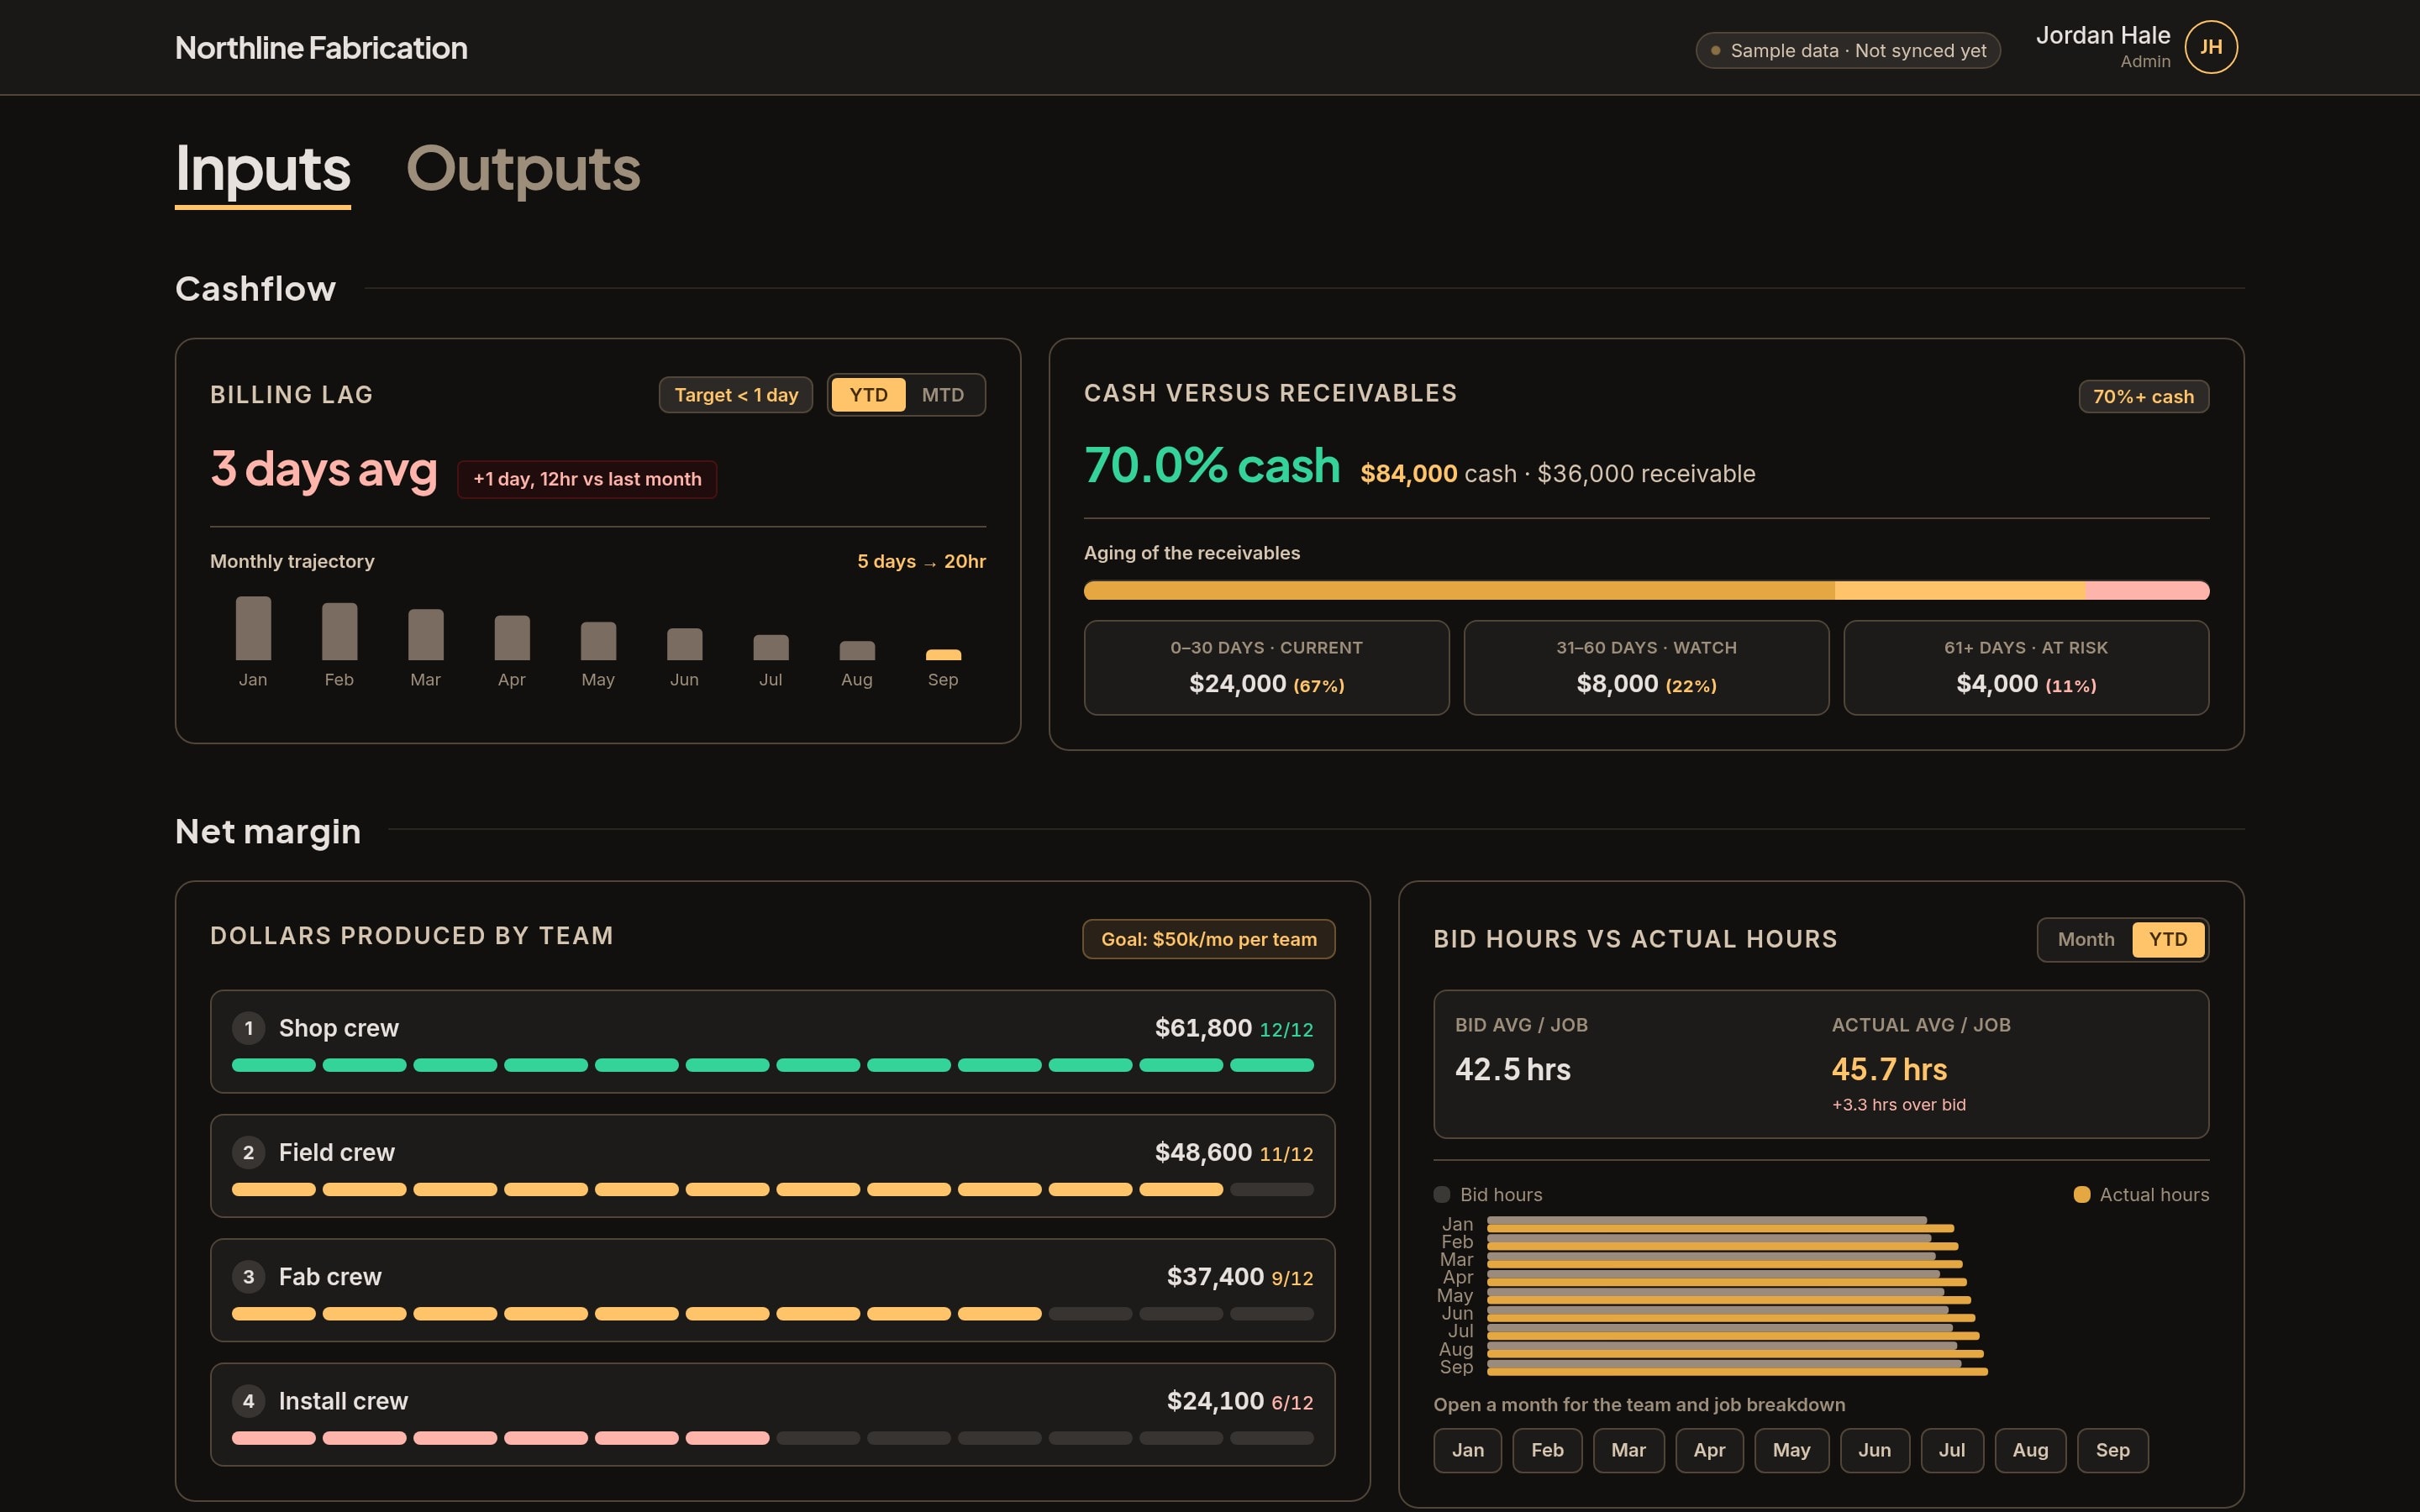
The inputs the shop watches: billing lag, cash on hand, crew production, and bid hours against actual hours.
- Role
- Design and build
- Status
- In use
- Built with
- Next.jsTypeScriptPostgresQuickBooksMonday.com
Context
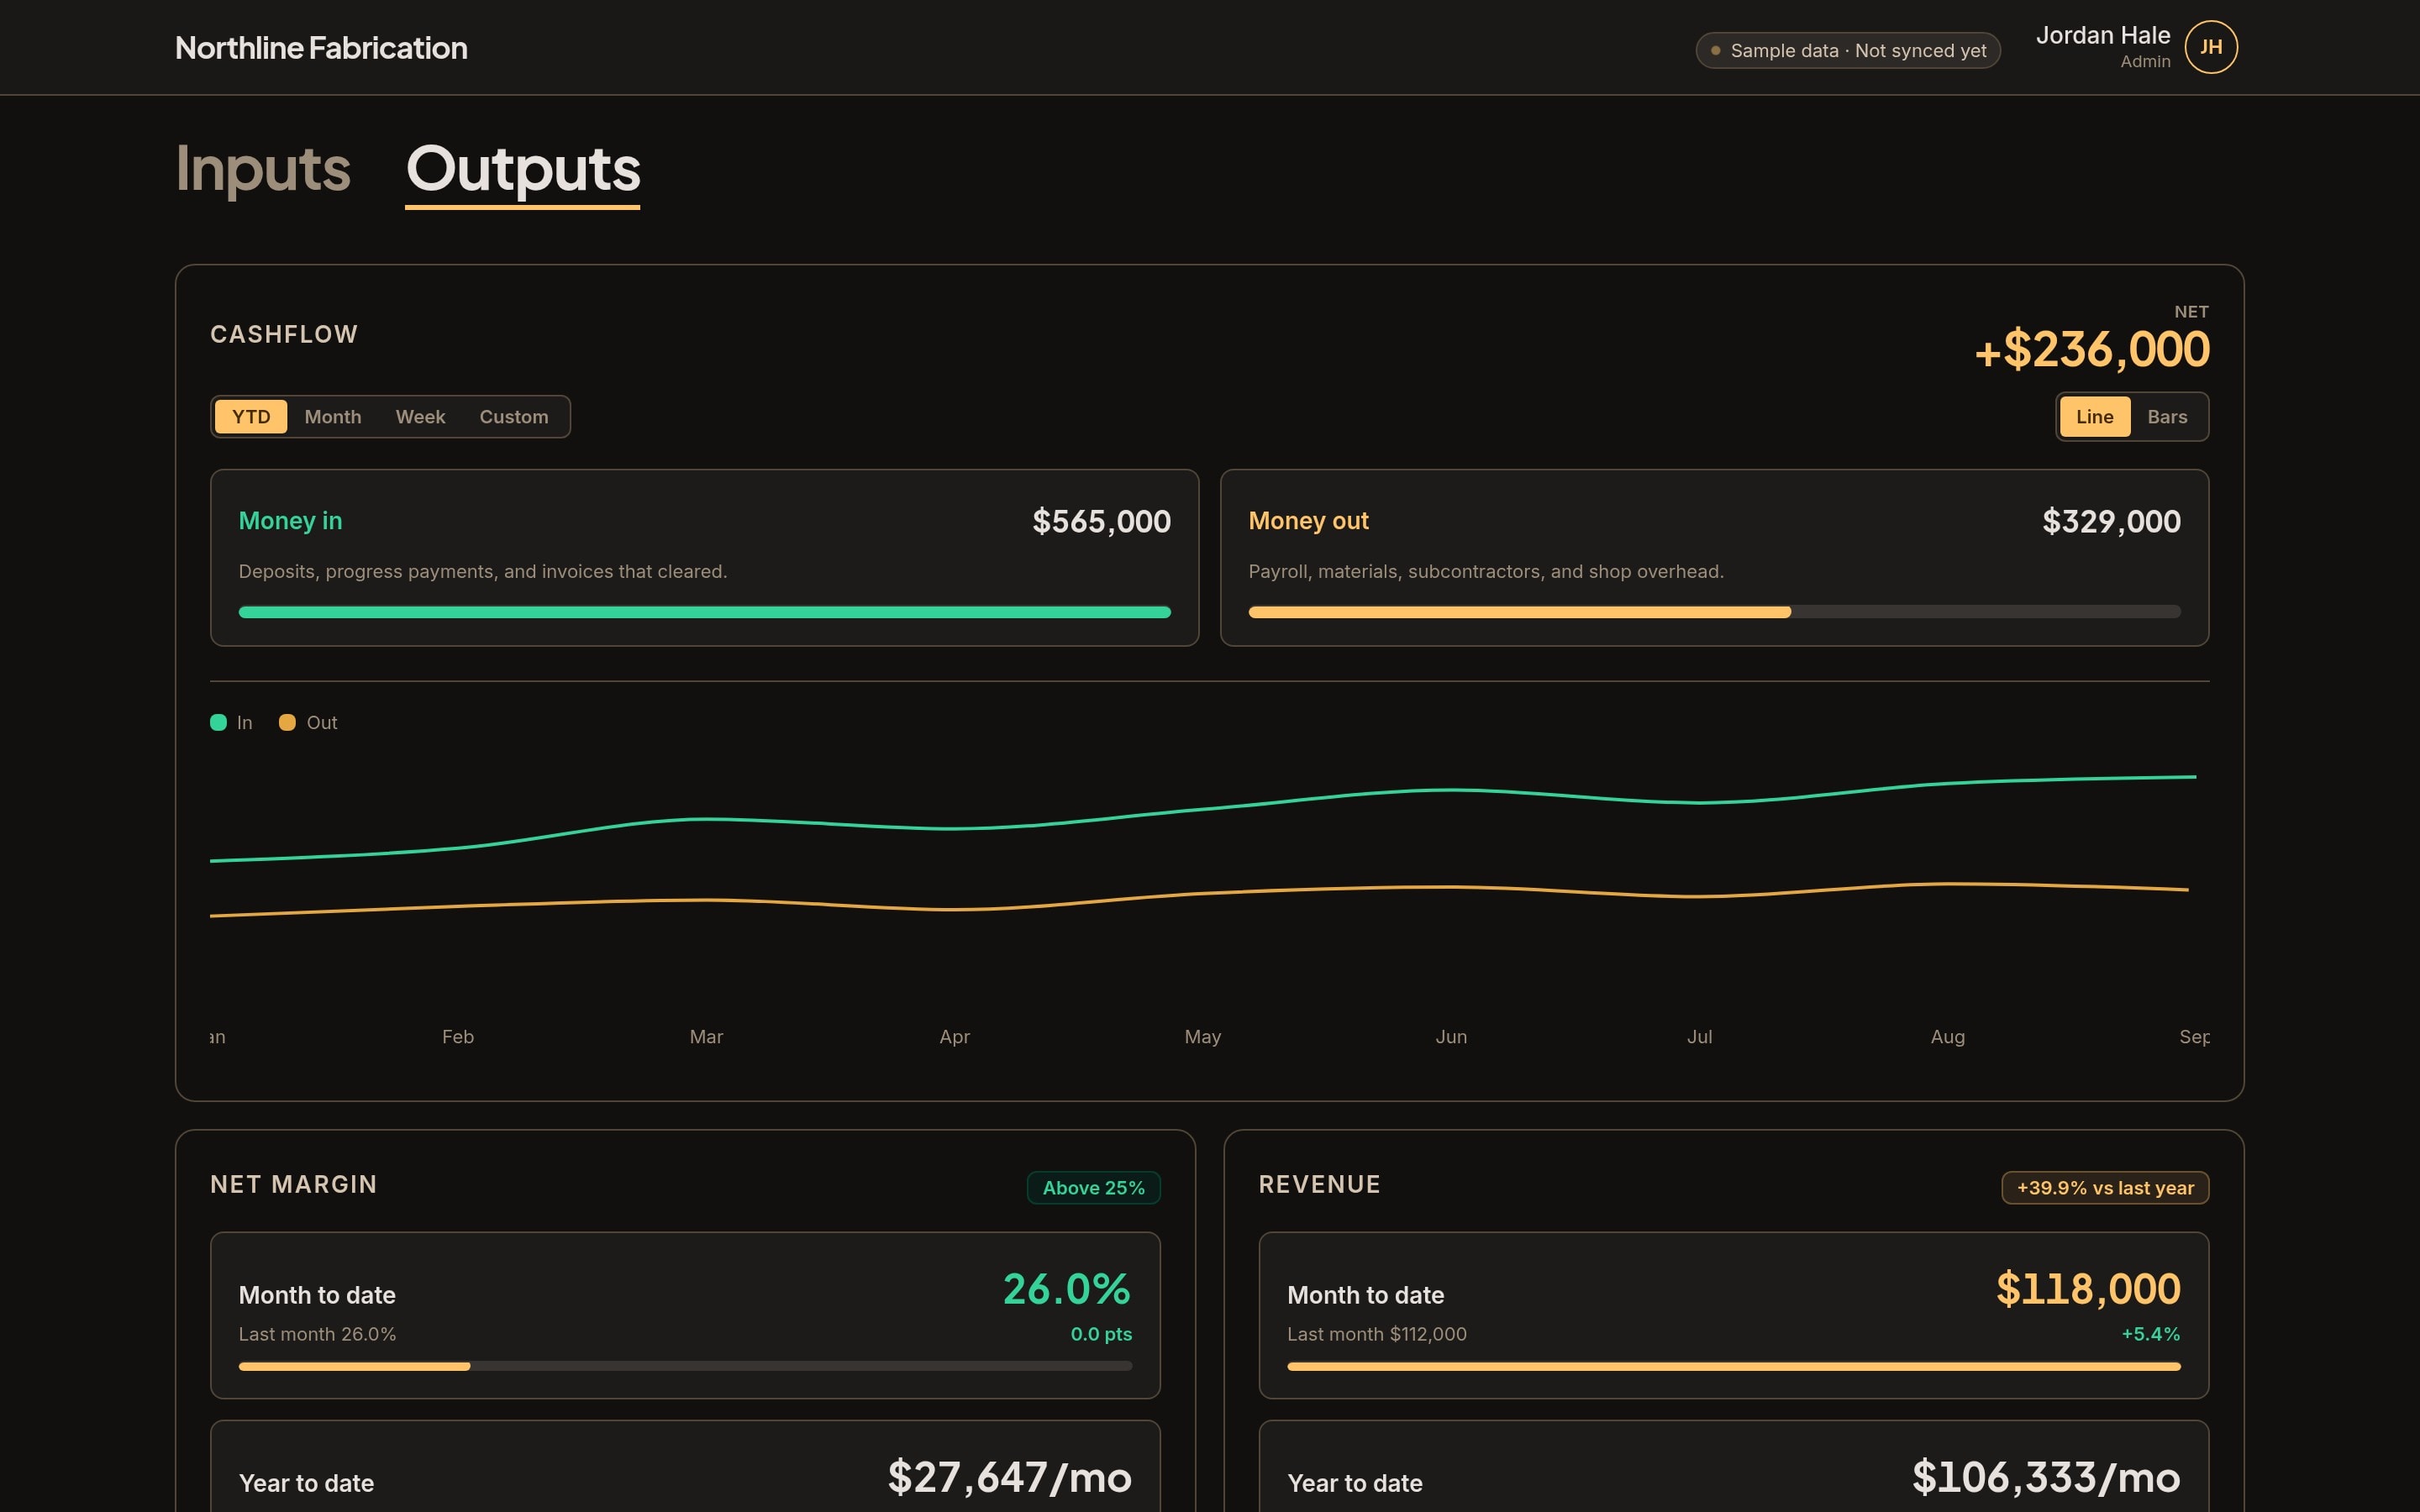
The shop already kept its books in QuickBooks and its jobs in Monday. The dashboard reads both on a schedule and puts the morning numbers on one board: money in and out, margin, revenue, how long billing takes, and whether a crew is ahead of the hours they bid.
What it covers
- A signed-in board with one view for the inputs the shop controls and another for the results
- A read-only sync from QuickBooks and Monday, on a daily schedule, with a screen that shows whether the last pull succeeded
- Goals with color: billing lag, cash versus receivables, dollars produced by crew, and bid hours against actual hours
- Accounts for the shop, with an admin choosing what each role is allowed to see
- Ranges the owner already thinks in — year, month, week, or a custom stretch — on the cashflow chart
Notes
The layout, the goals, and the sources are the tool the shop uses. The live board stays on a private sign-in.
This is the pattern when the data already lives in other systems and the business needs one place to read it, with access limited to the people who should see the numbers.